| STRATEGY | 8% SLEEVE WHOLE PORTFOLIO RETURNS |
25% SLEEVE WHOLE PORTFOLIO RETURNS |
||||
|---|---|---|---|---|---|---|
| Δ S&P | Move To | Hold PE | Strategy | Hold PE | Strategy | |
| 1-Apr-18 | 🡳 | SP | ||||
| 1-Jul-18 | 🡱 | PE | 0.31% | 0.66% | 0.96% | 2.06% |
| 1-Oct-18 | 🡱 | PE | 0.46% | 0.46% | 1.44% | 1.44% |
| 1-Jan-19 | 🡳 | SP | 0.32% | 0.32% | 1.02% | 1.02% |
| 31-Mar-19 | -0.12% | 1.05% | -0.37% | 3.27% | ||
| TTM Returns (Compounded) | 0.98% | 2.51% | 3.07% | 7.99% | ||
| Arbitrage Returns | +1.53% | +4.92% | ||||
| For illustrative purposes, assume zero returns for non-sleeve assets. If the product’s non-sleeve assets had positive returns, the actual arbitrage difference would be greater due to compounding effects. Therefore, in the real world, the arbitrage returns shown are likely to be understated. | ||||||
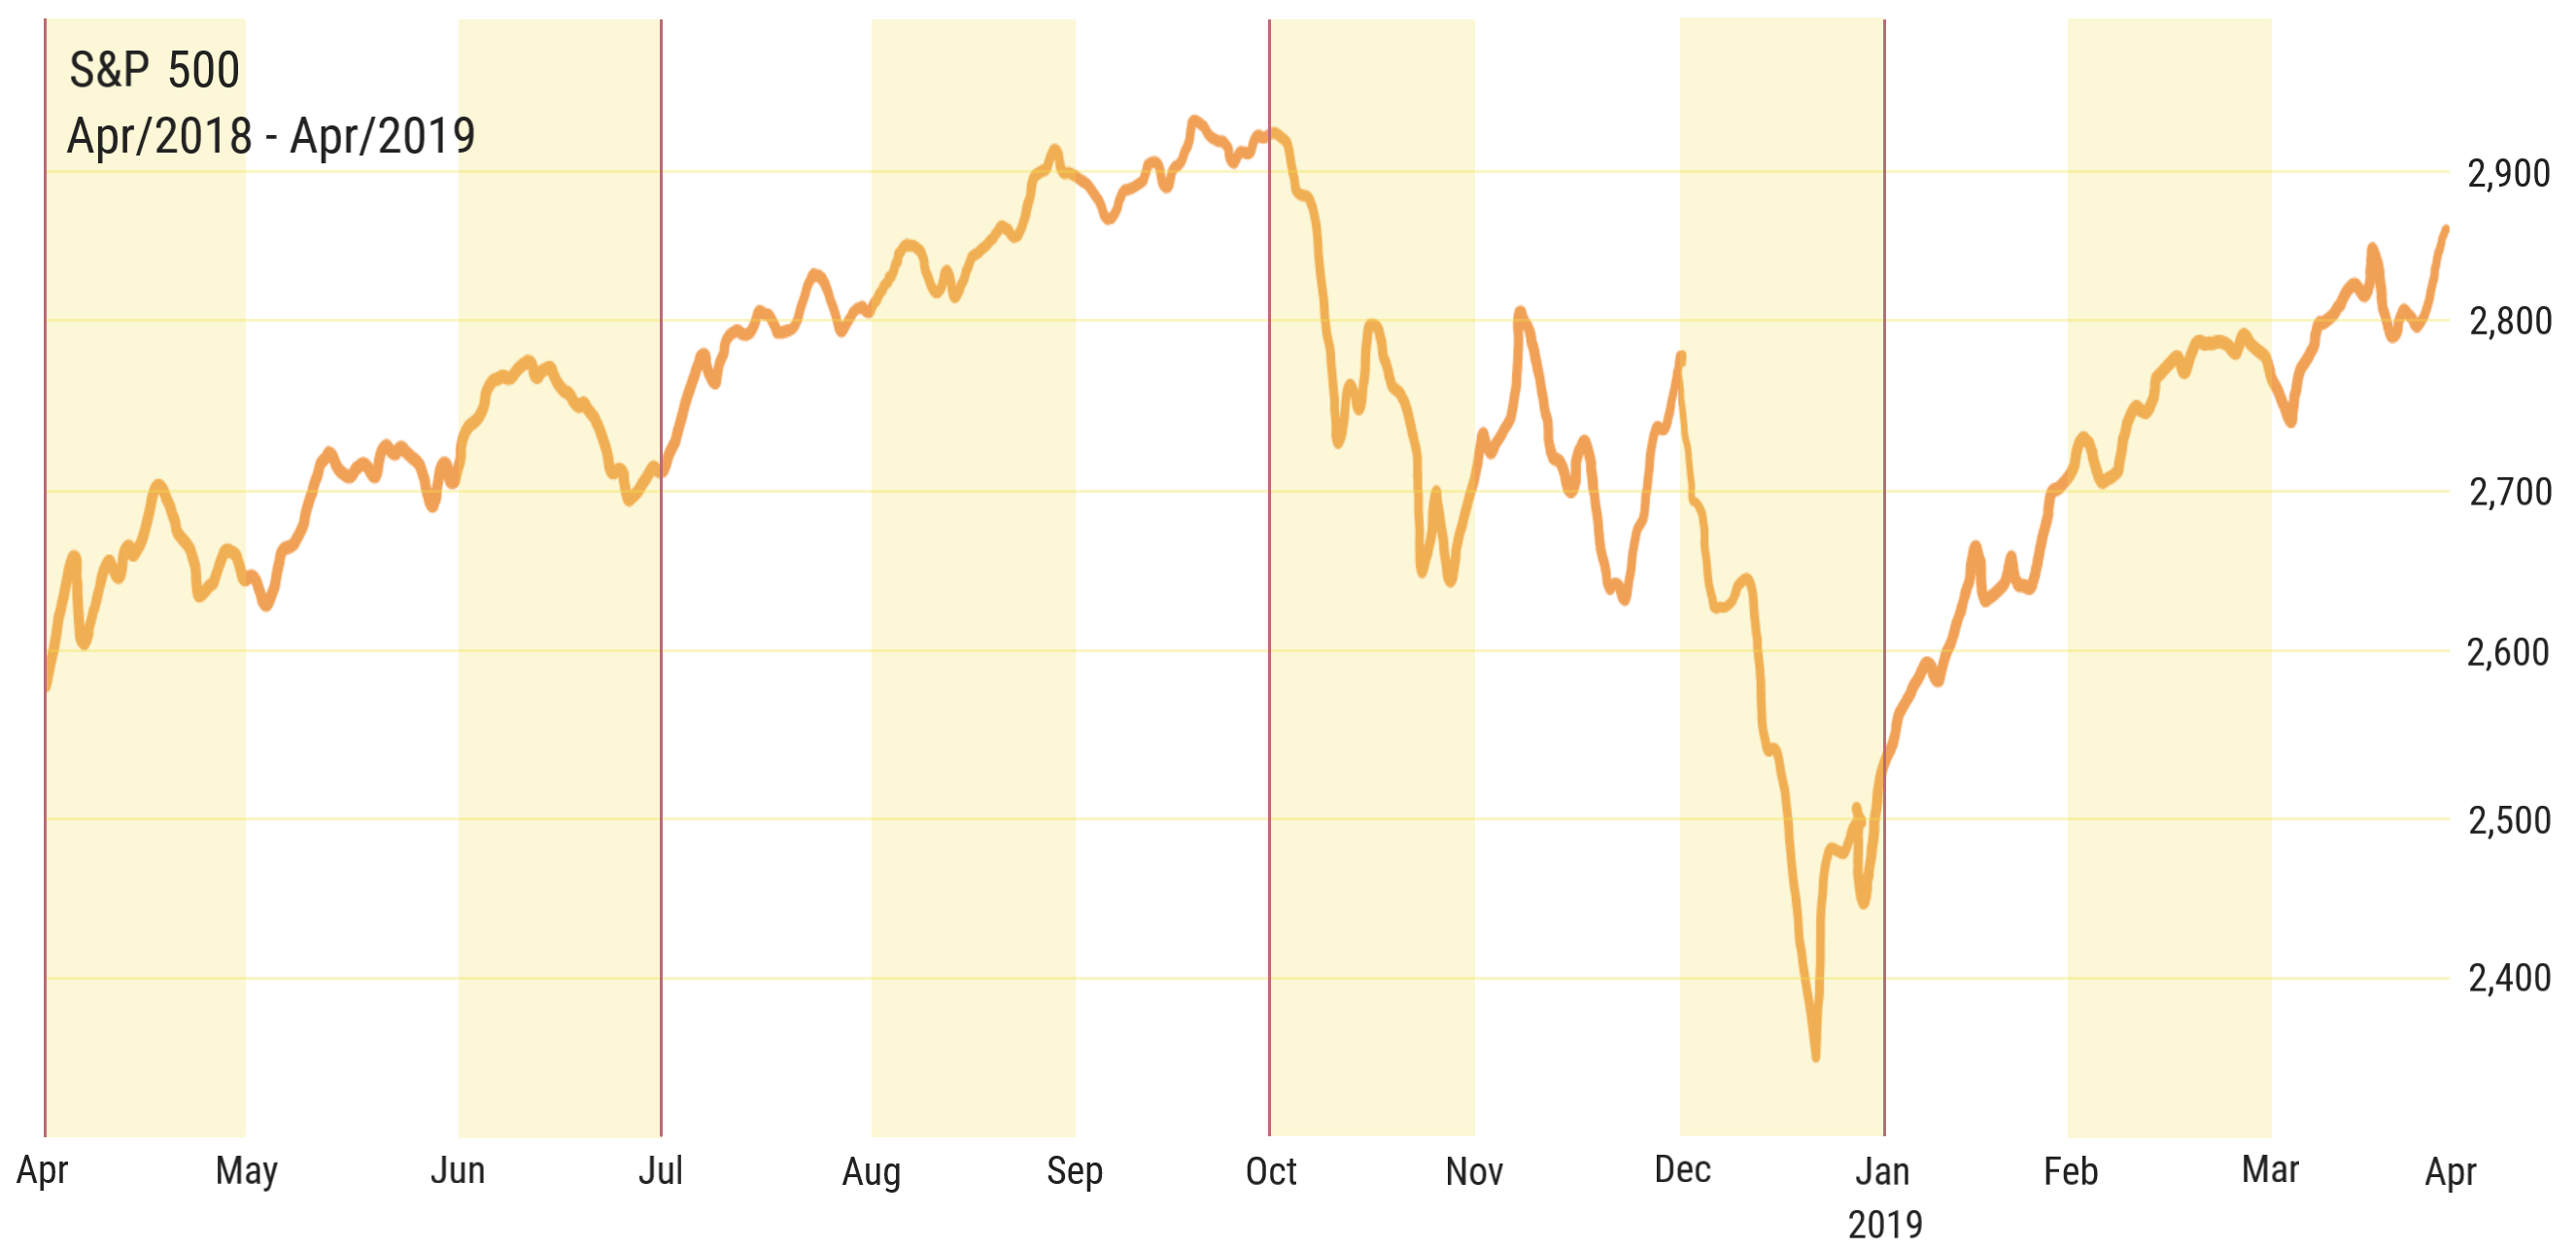
Consider two identical DC products except that one contains a sleeve of Private Equity (“PE”) and the other contains an identically-sized sleeve invested in the S&P 500 (“SP”). An opportunistic individual adopts the following strategy on the first day of each quarter (indicated by red lines on the chart at left):
• If the S&P500 went up in the preceding quarter, invest money in “PE” product.
• If the S&P 500 went down in the previous quarter, invest in “SP” product.
The strategy’s intent is to capture gains and avoid losses signaled by the S&P and which are contemporaneously unreported in PE due to reporting lag. Using real PE data but assuming zero returns from non-sleeve assets, for the TTM period to 31-Mar-19, the strategy improves returns:
- + 1.53% for an 8% sleeve;
- + 4.92% for a 25% sleeve.
Although this illustrative example is highly simplified, more complex real-life products without an accurate daily market adjustment will likely be vulnerable to similar arbitrage schemes. As shown, the level of vulnerability can be significant, even when illiquid sleeves are small. In the United States, there are already anecdotal reports of small groups of investors exercising prior knowledge arbitrage schemes in corporate DC plans with illiquid offerings. Incorporating an accurate daily market adjustment into the daily NAV and unit pricing procedure is necessary to remove this arbitrage source.
This briefing note was authored by:
Sidney Porter, Ph.D.
Chief Data Scientist and Co-Founder
FEV Analytics
For further information please email Contact@FEVanalytics.com to start a discussion.
Consider two identical DC products except that one contains a sleeve of Private Equity (“PE”) and the other contains an identically-sized sleeve invested in the S&P 500 (“SP”). An opportunistic individual adopts the following strategy on the first day of each quarter (indicated by red lines on the chart at right):
• If the S&P500 went up in the preceding quarter, invest money in “PE” product.
• If the S&P 500 went down in the previous quarter, invest in “SP” product.
The strategy’s intent is to capture gains and avoid losses signaled by the S&P and which are contemporaneously unreported in PE due to reporting lag.
Using real PE data but assuming zero returns from non-sleeve assets, for the TTM period to 31-Mar-19, the strategy improves returns:
• + 1.53% for an 8% sleeve;
and
• + 4.92% for a 25% sleeve.
| STRATEGY | 8% SLEEVE WHOLE PORTFOLIO RETURNS |
25% SLEEVE WHOLE PORTFOLIO RETURNS |
||||
|---|---|---|---|---|---|---|
| Δ S&P | Move To | Hold PE | Strategy | Hold PE | Strategy | |
| 1-Apr-18 | 🡳 | SP | ||||
| 1-Jul-18 | 🡱 | PE | 0.31% | 0.66% | 0.96% | 2.06% |
| 1-Oct-18 | 🡱 | PE | 0.46% | 0.46% | 1.44% | 1.44% |
| 1-Jan-19 | 🡳 | SP | 0.32% | 0.32% | 1.02% | 1.02% |
| 31-Mar-19 | -0.12% | 1.05% | -0.37% | 3.27% | ||
| TTM Returns (Compounded) | 0.98% | 2.51% | 3.07% | 7.99% | ||
| Arbitrage Returns | +1.53% | +4.92% | ||||
| For illustrative purposes, assume zero returns for non-sleeve assets. If the product’s non-sleeve assets had positive returns, the actual arbitrage difference would be greater due to compounding effects. Therefore, in the real world, the arbitrage returns shown are likely to be understated. | ||||||
This briefing note was authored by:
Sidney Porter, Ph.D.
Chief Data Scientist and Co-Founder
FEV Analytics
For further information please email Contact@FEVanalytics.com to start a discussion.
Consider two identical DC products except that one contains a sleeve of Private Equity (“PE”) and the other contains an identically-sized sleeve invested in the S&P 500 (“SP”). An opportunistic individual adopts the following strategy on the first day of each quarter (indicated by red lines on the chart below):
• If the S&P 500 went down in the previous quarter, invest in “SP” product.
The strategy’s intent is to capture gains and avoid losses signaled by the S&P and which are contemporaneously unreported in PE due to reporting lag.
| STRATEGY | 8% SLEEVE WHOLE PORTFOLIO RETURNS |
25% SLEEVE WHOLE PORTFOLIO RETURNS |
||||
|---|---|---|---|---|---|---|
| Δ S&P | Move To | Hold PE | Strategy | Hold PE | Strategy | |
| 1-Apr-18 | 🡳 | SP | ||||
| 1-Jul-18 | 🡱 | PE | 0.31% | 0.66% | 0.96% | 2.06% |
| 1-Oct-18 | 🡱 | PE | 0.46% | 0.46% | 1.44% | 1.44% |
| 1-Jan-19 | 🡳 | SP | 0.32% | 0.32% | 1.02% | 1.02% |
| 31-Mar-19 | -0.12% | 1.05% | -0.37% | 3.27% | ||
| TTM Returns (Compounded) | 0.98% | 2.51% | 3.07% | 7.99% | ||
| Arbitrage Returns | +1.53% | +4.92% | ||||
| For illustrative purposes, assume zero returns for non-sleeve assets. If the product’s non-sleeve assets had positive returns, the actual arbitrage difference would be greater due to compounding effects. Therefore, in the real world, the arbitrage returns shown are likely to be understated. | ||||||
• + 1.53% for an 8% sleeve;
and
• + 4.92% for a 25% sleeve.
This briefing note was authored by:
Sidney Porter, Ph.D.
Chief Data Scientist and Co-Founder
FEV Analytics
For further information please email
Contact@FEVanalytics.com
to start a discussion.